01344 770892investigations@trl.co.uk
TwitterLinkedin
  • TRL Main Site
Top bar menu
Search
Expert Witness & Investigations ServicesExpert Witness & Investigations Services
Expert Witness & Investigations Services
Proven. Trusted. Effective.
  • Why Us
  • Our Services
    • Collision Investigation & Reconstruction
    • Rapid Response Scene & Vehicle Inspections
    • Initial Appraisal Service
    • CCTV / Dashcam Footage
    • GPS / Cycle Computer Analysis
    • Mechanical Vehicle Inspection
    • EDR / Black Box Downloads
    • Injury Causation, including Seat Belt and Helmet Usage
    • 2D Scene Plans
    • 3D Simulation
    • Driver & Vehicle Visibility Assessments
    • Vehicle Infotainment / Telematics System Downloads
    • Tachograph Analysis
    • Vehicle Fire Investigation
    • Vehicle Identification
    • Highways Investigations
    • Collision Investigation Training
  • The Experts
  • Testimonials
  • News
  • Contact Us
Menu back  
Expert Witness Home > A Comparative Analysis of LGV Visibility Mapping: Does Size Really Matter?

A Comparative Analysis of LGV Visibility Mapping: Does Size Really Matter?

June 18, 2018Collision Investigation & Reconstruction, Driver & Vehicle Visibility Assessments, Highways Investigations

Blind spots around Large Goods Vehicles (LGVs) have long been identified as a potentially significant contributor to the cause of serious collisions involving pedestrians and cyclists.

Plotting drivers’ sight lines is often an important aspect of investigations into collisions between vehicles and these vulnerable road users. Such assessments are carried out in order to determine whether one party could have been visible to the other, had they been looking in a particular direction at a given moment.

Common collisions

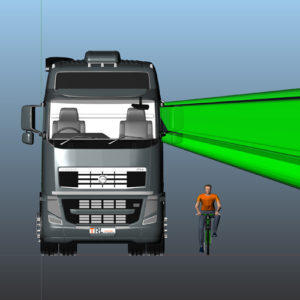
The most common scenarios for LGVs in collision with cyclists and pedestrians are when a truck is moving off from rest or turning left. TRL undertook a visibility assessment which identified that the areas of greatest risk extend across the full width of the front of the LGV and 5 metres down the nearside of the vehicle from the front.

Direct vision assessment

An analysis that seeks to represent the exact vision available to a particular driver can be flawed. Incident drivers are rarely available for visibility assessments, especially if the assessment is carried out at a live accident scene, whilst the driver is being interviewed by the police elsewhere or receiving medical help. In  these cases, investigators rely on a ‘stand-in’ colleague, of a similar height to the driver, to plot their visibility. As this traditional method is accepted as not being 100% accurate, TRL undertook a study to quantify what, if any, error is introduced into line of sight measurements when different height drivers are used. The objective was to calculate a percentage error to be applied as a confidence range to subsequent LGV assessments.

Does size really matter?

For the purpose of this study, digital models of two LGVs were used, allowing all variables to be kept consistent, except for the eye point of the driver. Assessing 5 drivers, all of varying heights revealed that there is not a definitive relationship between the height of the driver and the amount of direct vision available to them. The possibility to adjust the driver seat means that different height drivers can have very similar eye positions when driving. Or, conversely, several drivers of the same height may have markedly different eye positions.

LGV-3D-modellingBest practice

Best practice is to always use the incident driver for a visibility assessment. If the driver cannot be available to participate in an assessment, it may be possible to measure their eye point within the vehicle or with respect to other definable points and then use a movable arm and laser pointer method to plot their vision. This may be more accurate than plotting the vision of a ‘stand-in driver’. Although the area of vision and vehicle outline can be measured in two dimensions with a theodolite, a 3D laser scanner will provide a more accurate assessment, as well as allowing modelling which can be presented as images which are more readily understandable to Courts.

A common sense approach should be used; if an object is nearly completely visible, based on a generic assessment, it is probably true that the object will be at least partly visible if the limit of vision is moved. If a conclusion is to be drawn that an object was available to be seen, but the incident driver has not been available for the investigation, it may be necessary to ‘test’ the modelling. This can be achieved by moving the line of ground visibility closer to and further away from the vehicle, redrawing the visibility plane, and checking whether the conclusion still stands. It is likely that this approach would also assist in accounting for the unknowable variables such as seat height movement. Download the full report

Find out more information on LGV visibility assessments and how we use computer modelling in road accident investigations

3D modellingExpert Witness & InvestigationsLGVTRLvisibility assessment
Related posts
Fatal velodrome incident case review – another viewpoint
November 5, 2021
Technical series: Vehicle wheel loss
October 5, 2021
Technical series: What is Aquaplaning?
October 5, 2021
Best Practice for New Instructions
June 15, 2021
The Importance of Visibility
March 23, 2021
The importance of best practice when investigating lorry rollover
March 15, 2021
Search
Recent Posts
  • Pedestrian safety | Airbags
  • TRL Technical Series: Video Analysis | Calculating distance and speed
  • A history of impact biomechanics, Part 2 – from TRL beginnings to the 1990s
  • A history of impact biomechanics, Part 1 – from the Ancient Greeks to the 1970s
  • TRL Technical Series: Load Security
News Archive
  • April 2022
  • March 2022
  • December 2021
  • November 2021
  • October 2021
  • June 2021
  • March 2021
  • December 2020
  • October 2020
  • September 2020
  • December 2019
  • September 2019
  • August 2019
  • July 2019
  • May 2019
  • January 2019
  • December 2018
  • November 2018
  • September 2018
  • August 2018
  • July 2018
  • June 2018
  • May 2018
  • April 2018
  • March 2018
  • February 2018
  • January 2018

Proven, Trusted, Effective

To find out more about our Team & the Services we offer, please email investigations@trl.co.uk  or call 01344 770892

Contact Us
Services
  • Collision Investigation & Reconstruction
  • Rapid Response Scene & Vehicle Inspections
  • Initial Appraisal Service
  • CCTV / Dashcam Footage
  • GPS / Cycle Computer Analysis
  • Mechanical Vehicle Inspection
  • EDR / Black Box Downloads
  • Injury Causation, including Seat Belt and Helmet Usage
 
  • 2D Scene Plans
  • 3D Simulation
  • Driver & Vehicle Visibility Assessments
  • Vehicle Infotainment / Telematics System Downloads
  • Tachograph Analysis
  • Vehicle Fire Investigation
  • Vehicle Identification
  • Highways Investigations
  • Collision Investigation Training
Contact Us

01344 770892
investigations@trl.co.uk

Investigations Group
TRL Limited
Crowthorne House
Nine Mile Ride
Wokingham
Berkshire
RG40 3GA

Expert Witness & Investigations Services
TRL Registered Office: Crowthorne House, Nine Mile Ride, Wokingham, Berks, UK, RG40 3GA. Registered in England, No. 3142272, VAT Registration 664 625 321.
© Copyright 2020 TRL. All rights reserved.
  • Terms & Conditions
  • Privacy Notice
  • Accessibility
Boilerplate